
PanoptesObservability and analytics
See every log, trace, cost and decision across the platform.
What every service, Virtual Employee and model did, how long it took, what it cost and who approved it.
We’ll spend 30 minutes with you on one of your workflows, and you don’t need to share any data.
Where Panoptes works
Every log, trace, cost and decision (Panoptes). These are the onboarding steps it works in, from your first decision to live work, and after go-live.
- Step 4 · DataCheck, protect and prove the dataRemoves: The data surprise after go-live.
- Step 7 · TestTest it, try to break it, fix itRemoves: “Trust us.”
- Step 8 · Sign offSign off and verifyRemoves: “Who approved this?”
- Step 9 · ShadowRun in shadow mode and prepare the teamRemoves: The leap of faith from test to live.
- After go-live · OperateOperate: watch, re-test, decideRemoves: Silent drift, and spend nobody can justify.
What Panoptes does
Panoptes is Inovagio’s observability and analytics product: it takes in OpenTelemetry traces, metrics and logs from every Inovagio product and any OTLP producer, keeps them in one store on your own servers, and shows what every service, Virtual Employee and model did, how long it took, what it cost and who approved it.
Open OpenTelemetry ingest
Traces, metrics and logs arrive over OTLP from every Inovagio product or any OpenTelemetry producer, acknowledged only once the write is durable.
One store for every product
All telemetry lives in MNEMOS, partitioned by tenant and signal, with retention per signal and a size cap.
Search and analytics
Search logs, look up traces, and query metrics with rate, sum-by and percentile functions, always bound to the caller’s tenant.
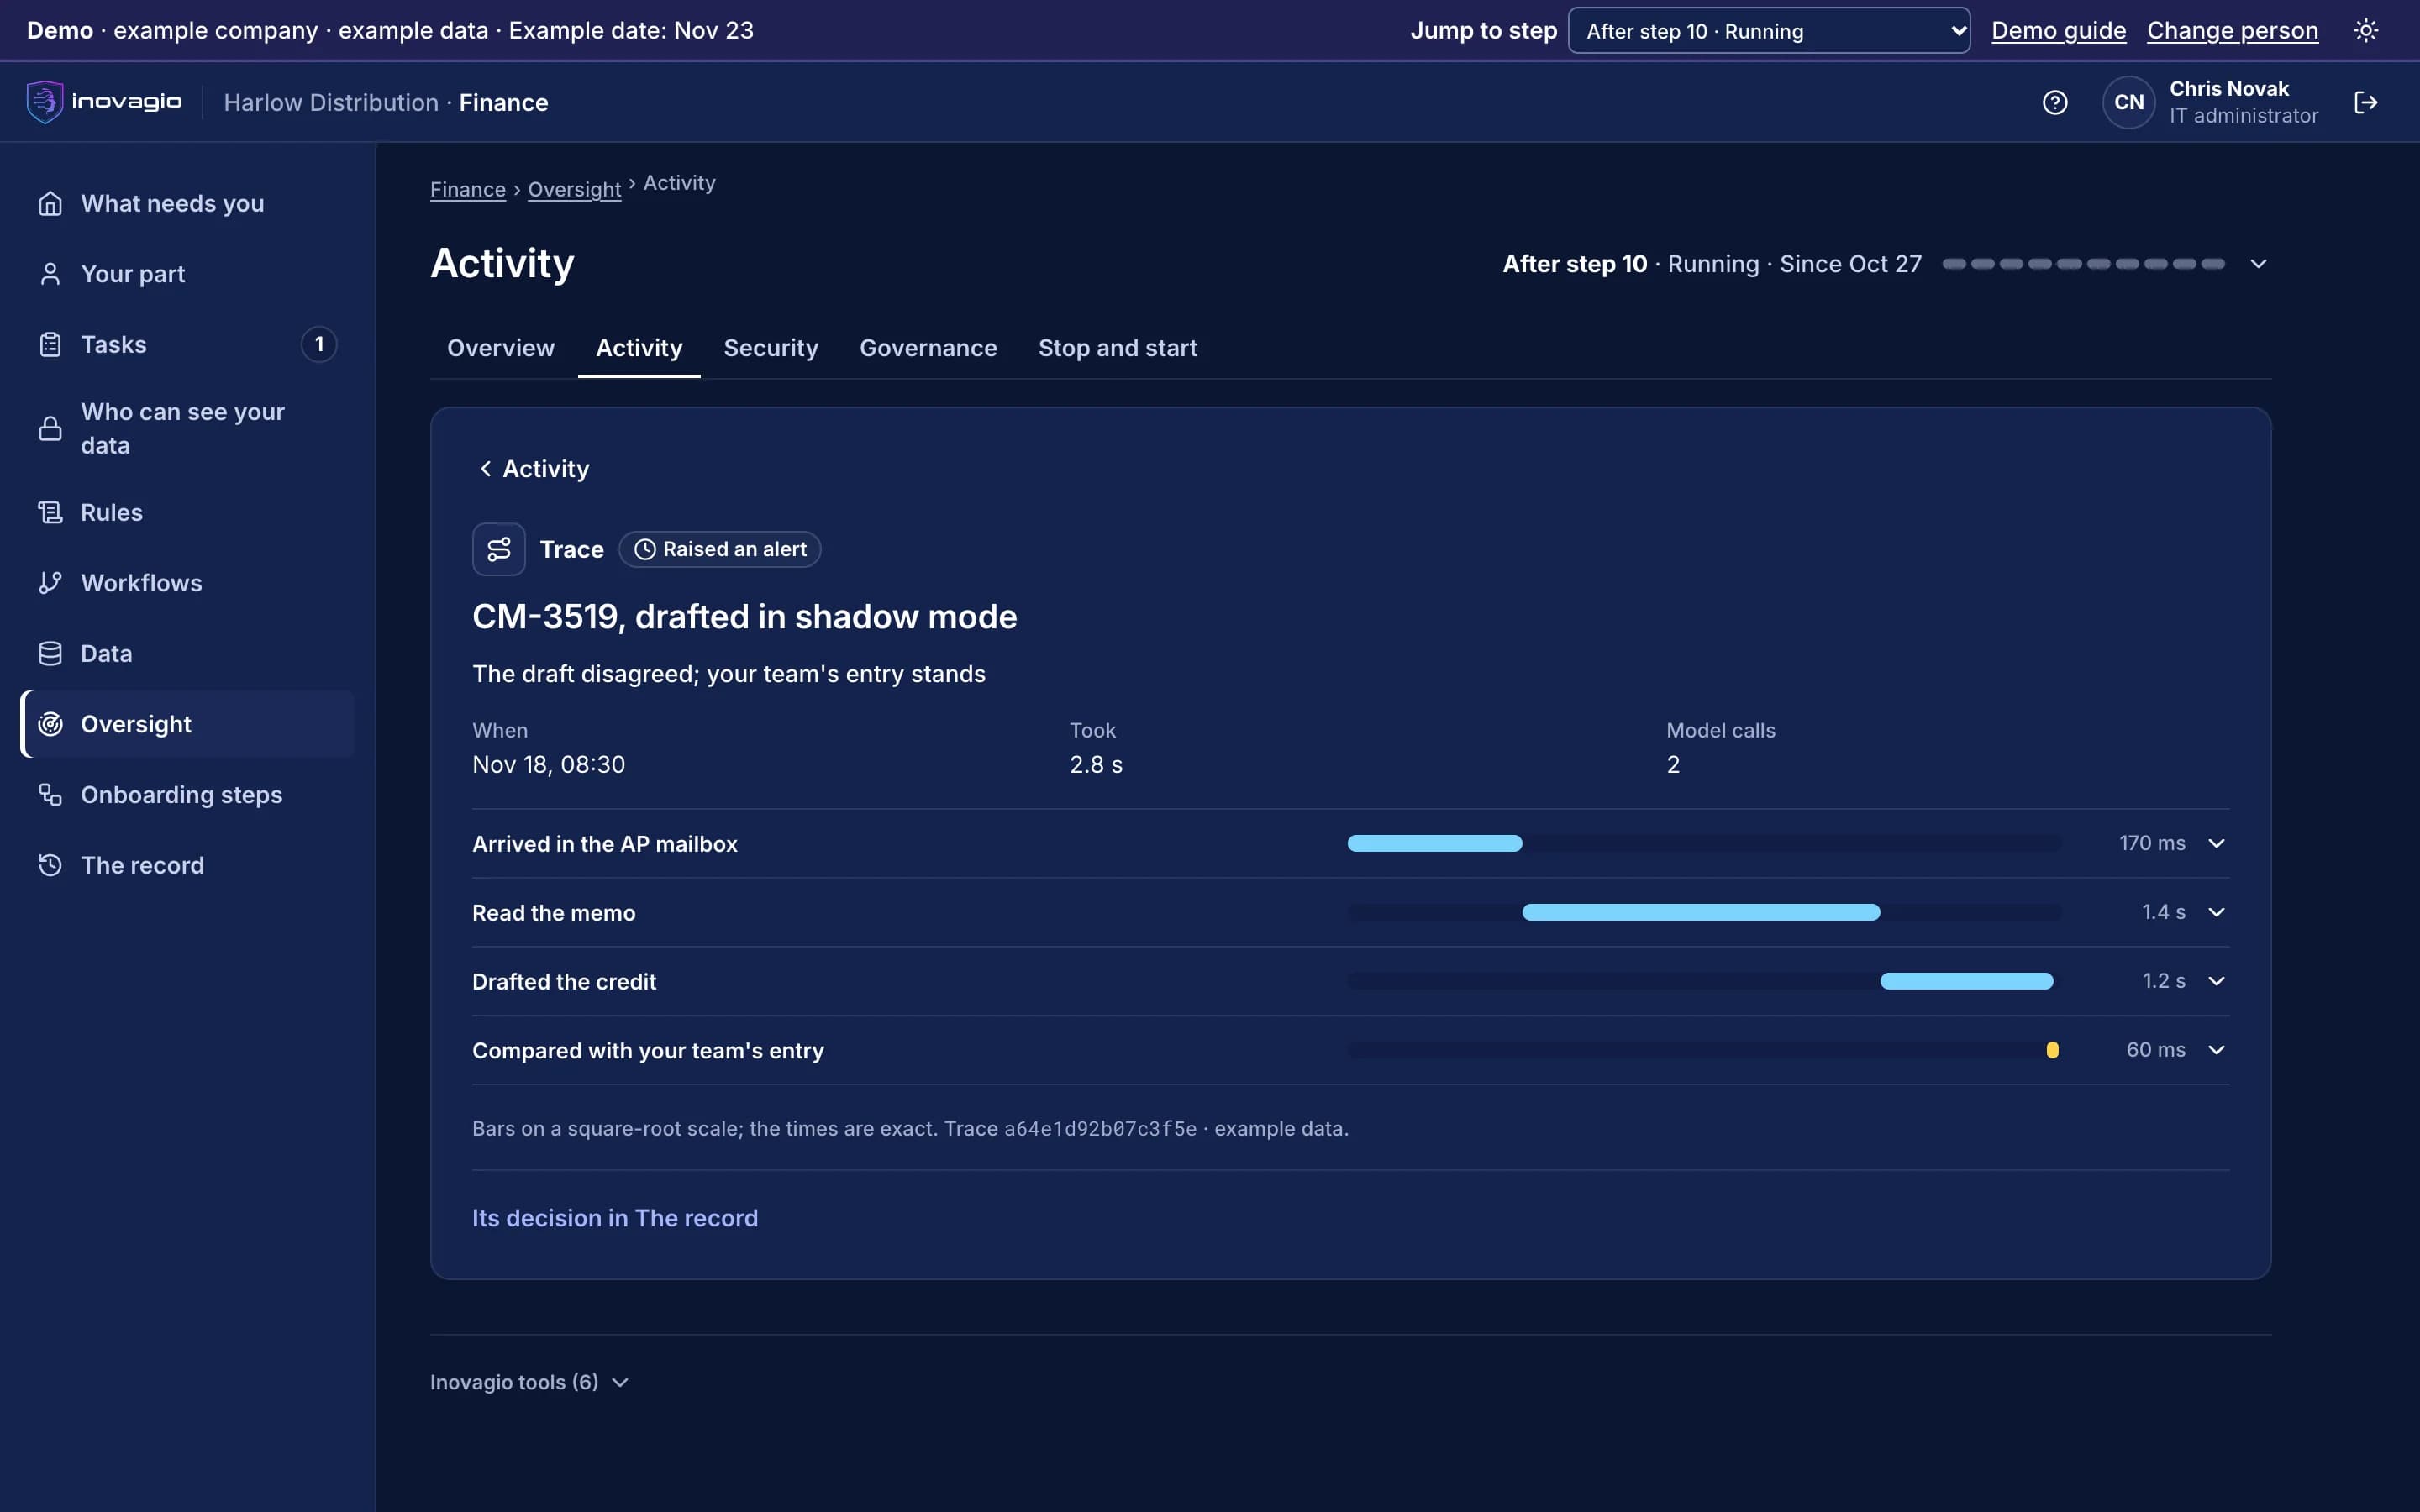
Every run as one trace
A goal, its workflow steps, tasks, tool calls and model calls appear as one trace, with each hop’s logs inline, from desktop through gateway, sign-in and model.
Cost and tokens per task
Token usage and cost are recorded for each model call and rolled up per task, workflow, tenant and service.
Inference you can read
Inference-server telemetry shows each request’s queue, prefill and decode time, and a stage it cannot measure is shown as unknown, never as zero.
Governance next to operations
Every approval, denial, kill-switch event, safety block, budget cap and model swap appears beside the operational signals, linked to the same run.
Dashboards and alerts
Service map, failures, performance and live metrics dashboards, plus scheduled alert rules with history and per-tenant destinations.
Your data, your tools
Telemetry stays on your servers by default, and because every product speaks standard OTLP you can also send it to your own monitoring stack.
Panoptes at work
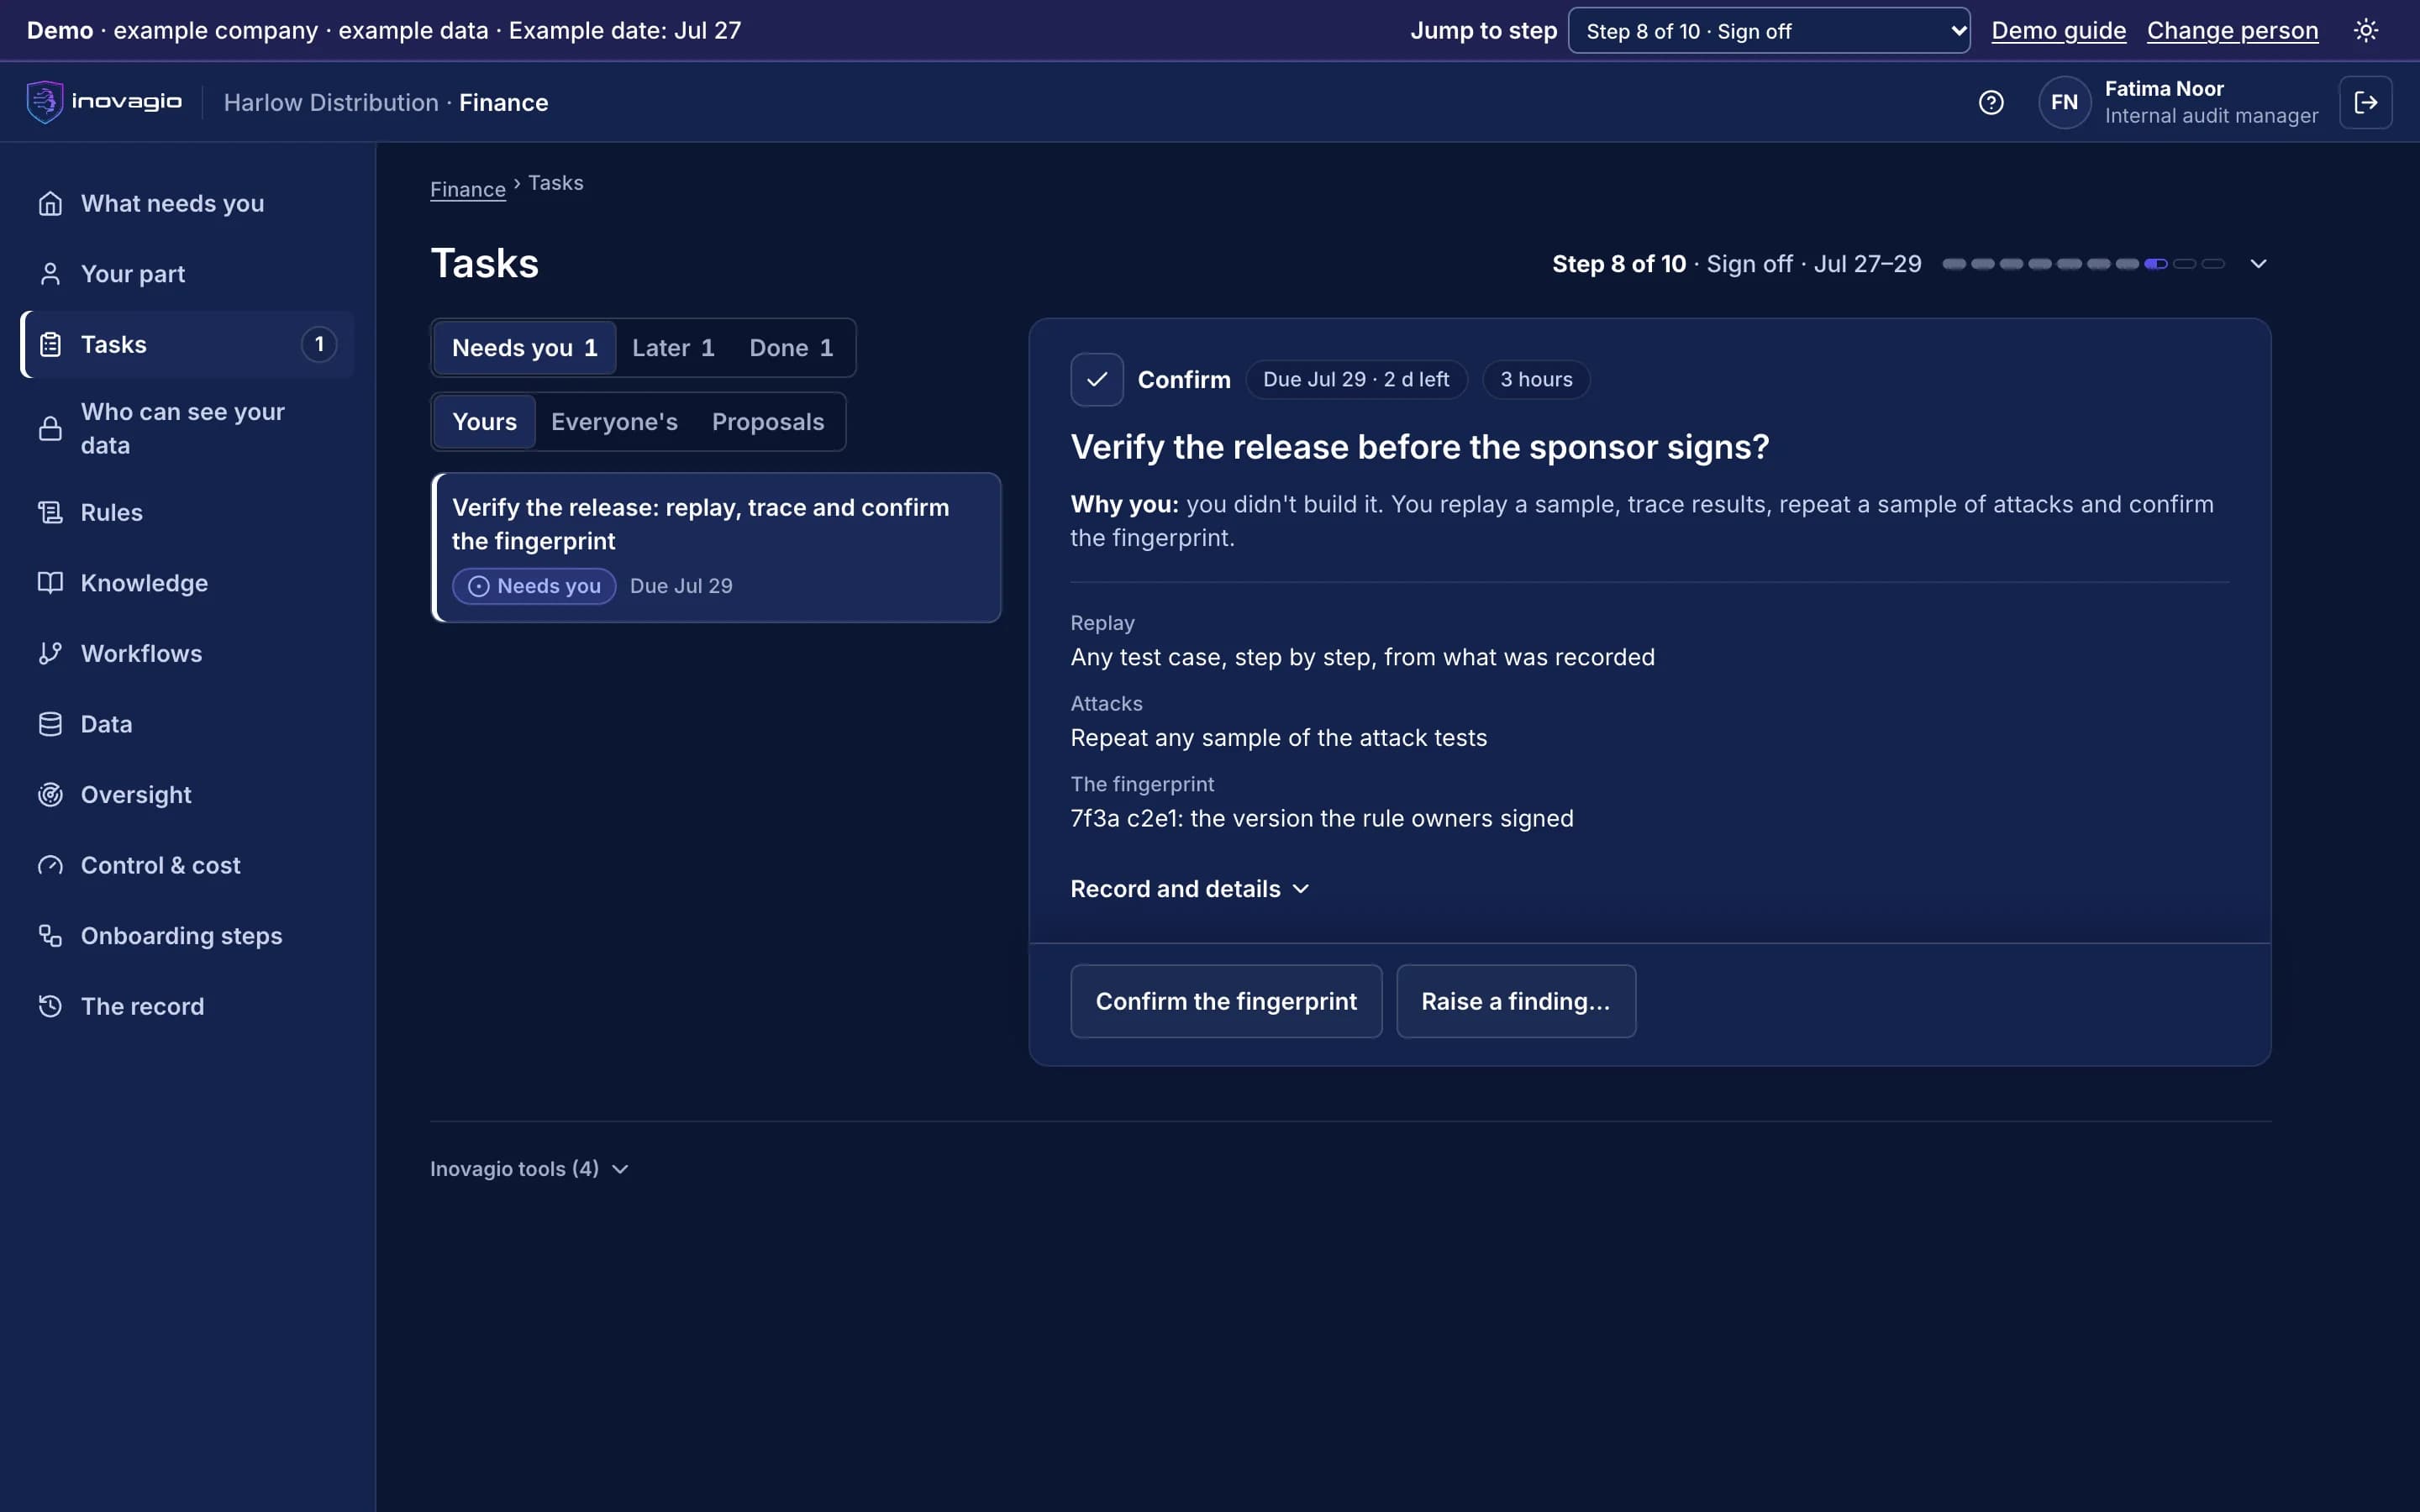
In the App at step 8: Sign off and verify.
- Replay any test case, step by step, from what was recorded.
- Repeat a sample of the attack tests.
- Confirm the fingerprint: the exact version the rule owners signed.
Inside Panoptes
The views Panoptes gives the people who run it, on sample data from Inovagio’s example companies.
- Synesis
- Virtual Employees
- Agent Harness
- Opsis
- Origin
- Phylax
- Operations
- Platform services
Service levels, this month
Objectives per product, with error budget used
Objectives
| Product | Objective | Budget used |
|---|---|---|
| Virtual Employees | 99.9% tasks finish | 18% |
| Origin | First token p95 under 800 ms | 41% |
| MNEMOS | 99.95% queries | 6% |
| Guard | p95 under 120 ms | 12% |
| Connect | Syncs on schedule | 27% |
Open alerts
2 openOrigin p95 rising
12 minMid-size model queue at peak hours
Connect sync slow
40 minPayer portal answering late
Guard latency normal
3 hResolved by a scale-up
Origin · p95 response time against objective
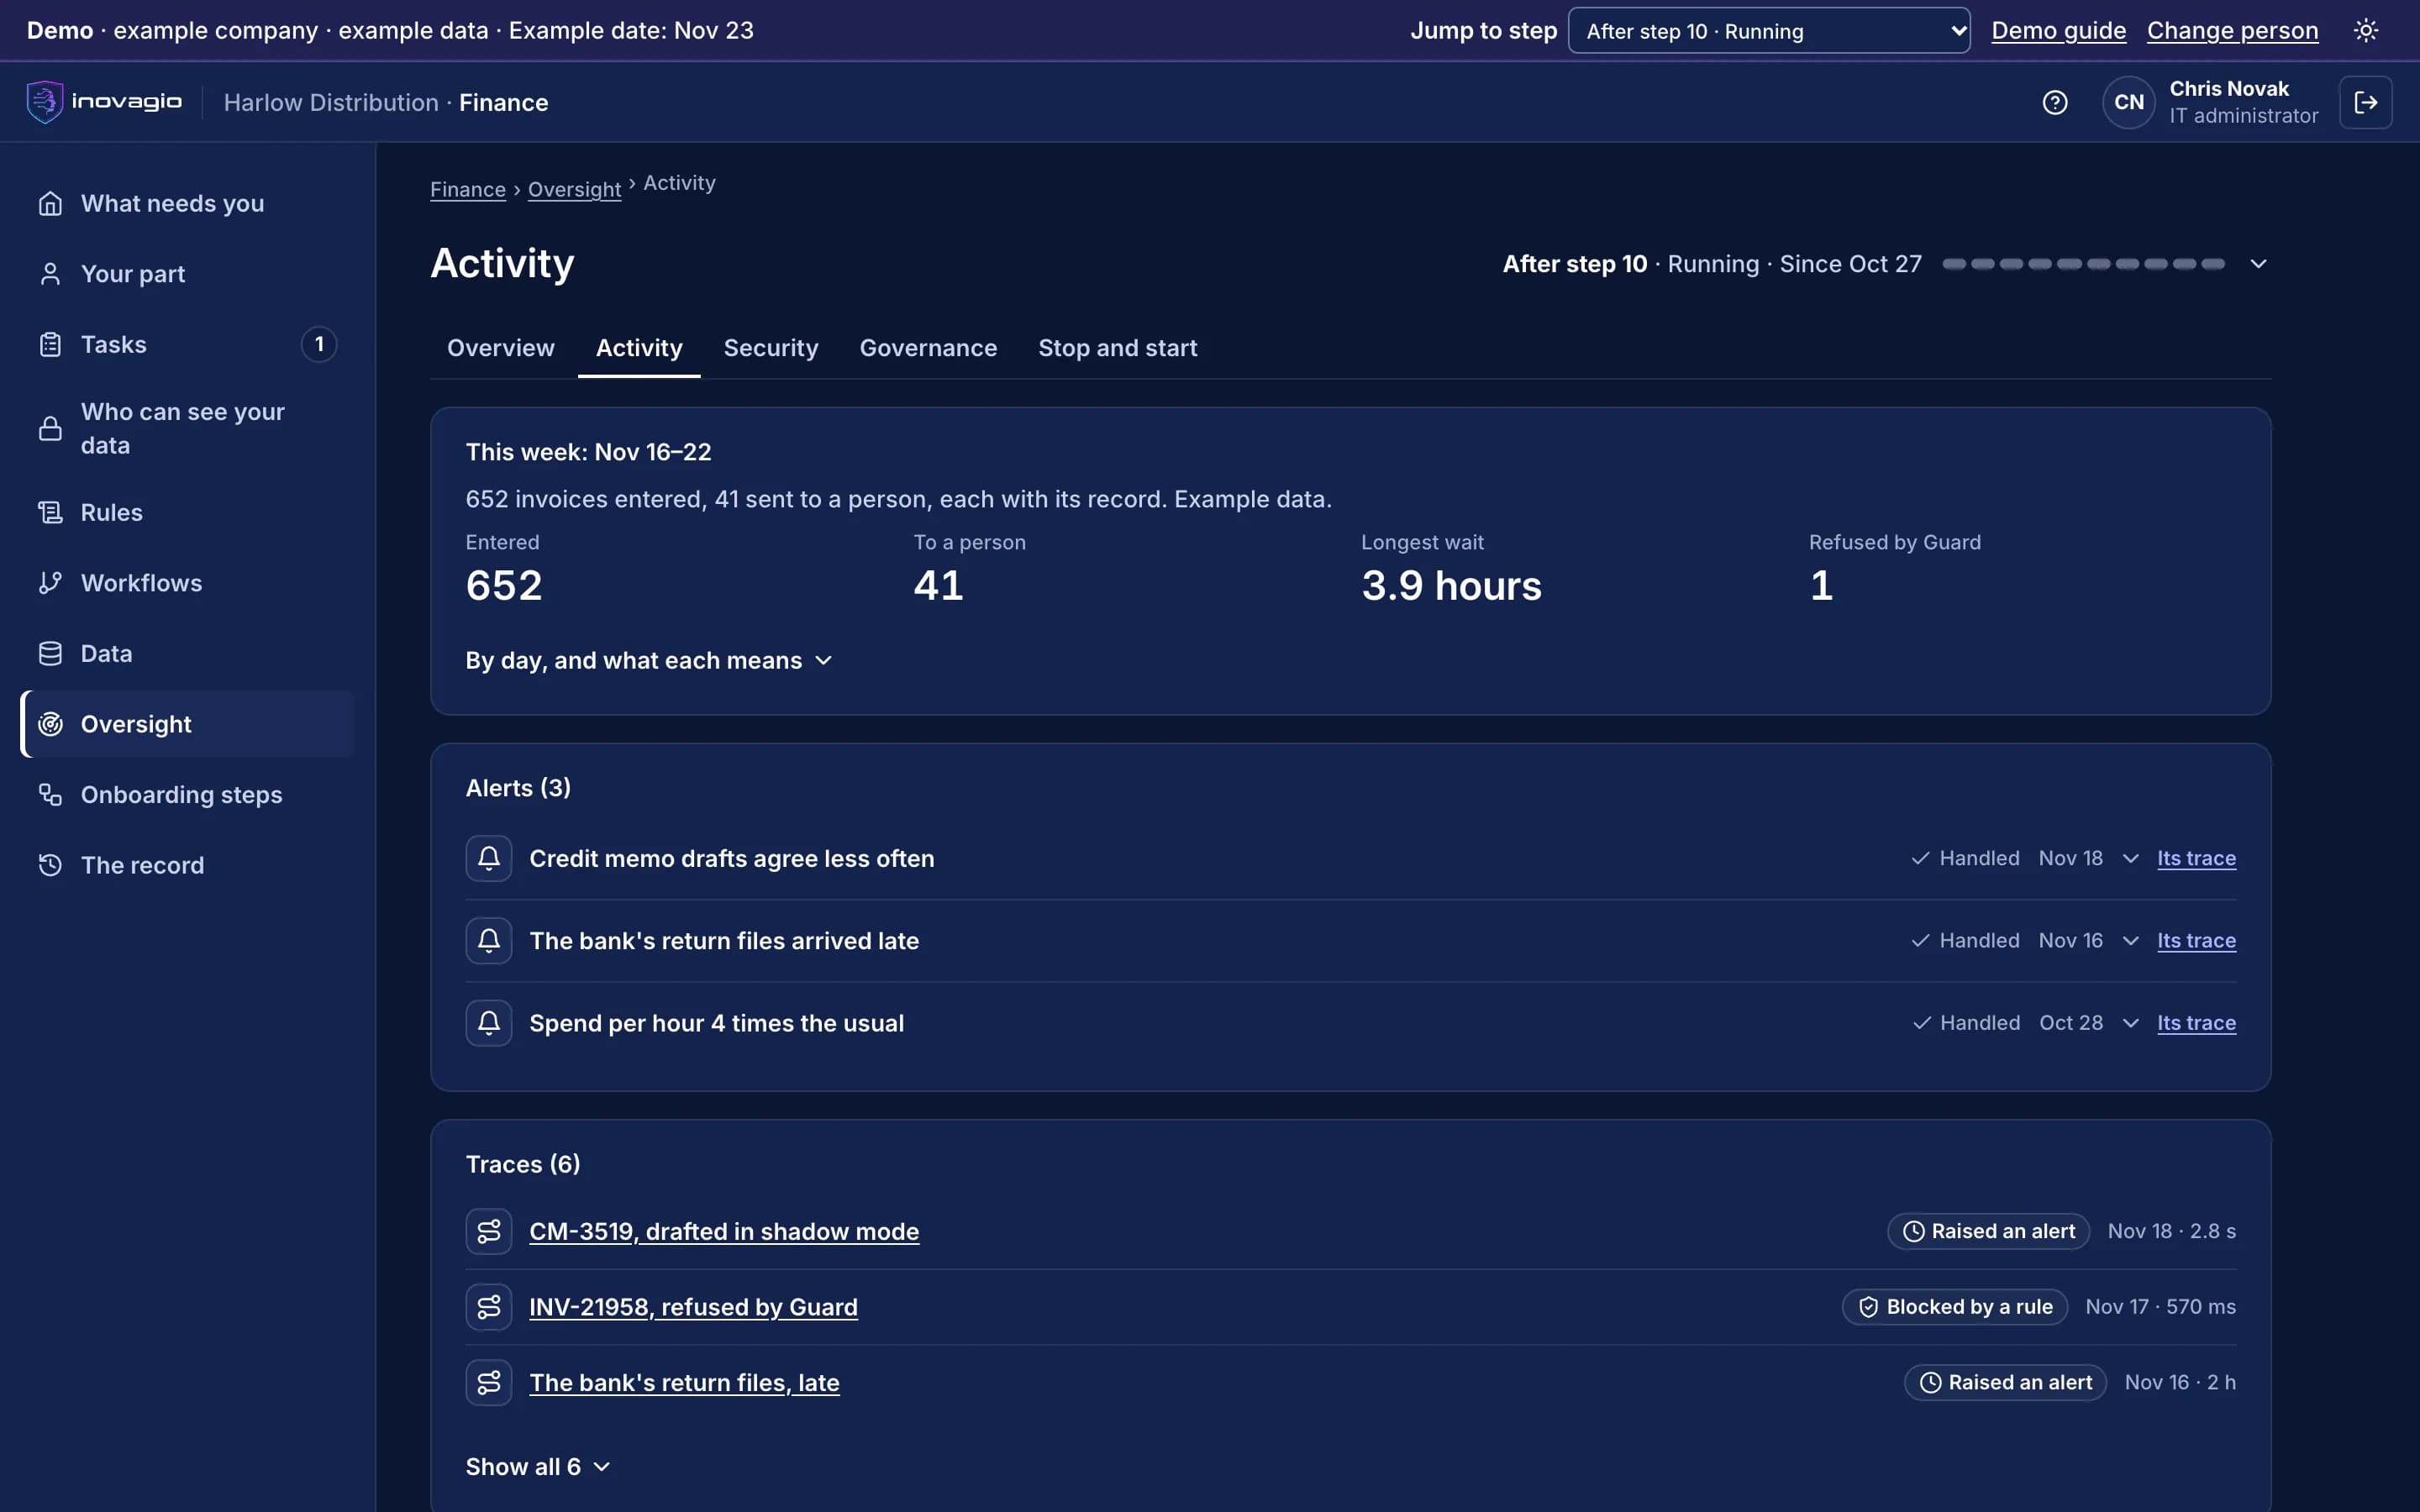
Panoptes › Activity: this week’s tasks and how many went to a person, the longest wait, the alerts handled and the trace of each task. Sample data from Inovagio’s example companies.
Everything Panoptes does, by area.
Ingest and storage
- OTLP/HTTP endpoints for traces, logs and metrics
- Acknowledgement after the durable write
- Redaction before anything is written
- Per-signal retention with a size cap
- Bounded local spool in every producer, replayed after an outage
- Host telemetry: CPU, memory pressure, swap, process memory, disk, network
- Standard OpenTelemetry configuration on every product
Search and analytics
- Time-bounded log search
- Trace retrieval and single-trace waterfall
- Transaction search with an end-to-end view
- Metrics instant and range queries
- Rate, sum-by and percentile functions
- Roll-ups per tenant, service, operation and minute, stored as durable metrics
- Report export
AI and agent views
- Goals, workflows, tasks, tool calls and model calls
- Running goals and tasks with step, elapsed time, tokens, granted tools and pending approvals
- Token usage and cost per model call and per task
- Queue, prefill and decode waterfall per inference request
- Replay a completed run from its audit trail
- Usage, metering and ROI views
Dashboards, governance and alerts
- Service map with rate, latency and failure rate per edge
- Failures and performance by operation
- Live metrics
- Approvals, denials, kill switches and safety blocks beside operational data
- Scheduled alert rules with history
- Webhook and incident-management destinations
- Every read authenticated, tenant-bound and audited
What Panoptes replaces
Panoptes does the work of these, inside one platform with one identity, one policy and one record:
- Hosted observability platform
- Separate stores for logs, metrics and traces
- Application performance monitoring tool
- Generic dashboards that do not understand AI workloads
- Usage and cost spreadsheets for AI work
The controls Panoptes brings
Every Inovagio product keeps the same five commitments, because regulated work needs all five at once.
Security
Telemetry stays in your environment, and the services that reach your systems redact personal data from the log and audit entries they write.
Governance
Who may see which views and data is set by role.
On the record
Audit and security views sit alongside operations, from one record.
Monitoring
Every product’s logs, traces and metrics in one place.
Cost per task
Tokens and cost per task, agent and workflow, so you can see where the money goes.
Panoptes in your industry
Every industry runs the same ten steps, so Panoptes does the same job in each, on that industry’s own work.
- Financial servicesBanks, credit unions, lenders and insurersWorked example: Alder Ridge Community Bank · Example company
- Healthcare providersHealth systems, hospitals and physician groupsWorked example: Meridale Health · Example company
- Health plansMedicare Advantage, Medicaid and commercial plansWorked example: Ashgrove Health Plan · Example company
- LegalLaw firms and in-house legal teamsWorked example: Calloway Finch · Example company
- GovernmentState, county and city agenciesWorked example: City of Larkhaven · Example company
- DefenseDefense contractors and their suppliersWorked example: Keelstone Aerospace · Example company
- Finance operationsFinance teams in any industry
For developers: Panoptes at a glance
- Standards
- OpenTelemetry (OTLP/HTTP); W3C Trace Context
- Engine
- Its own ingest, store and query engine, with roll-ups and views on top
- Store
- MNEMOS telemetry engine on your servers
- Default retention
- Metrics 15 days, logs 30 days, traces 14 days, all configurable, with an alert before the oldest data ages out; audit records keep their own retention in the audit ledger
- Ingest endpoints
- OTLP endpoints for traces, logs and metrics
- Access control
- Platform roles; tenant bound from the viewer’s own token; no shared super-reader credential
- Console
- Server-rendered pages in the Inovagio console, plus desktop panels
- Platforms
- macOS, Linux and Windows servers
Panoptes in the platform.
Where Panoptes fits
One platformAgent HarnessAgent harness
Inovagio CLIInovagio DesktopWeb ChatInovagio SDK
OpsisExperience layer
FolioMorphe
Virtual EmployeesVirtual Employee layer
NexusErgon
SynesisKnowledge layer
PerceptionMNEMOS
OriginModel layer
Inference ServerForge
PhylaxTrust layer
AuthInovagio SecretsGuard
Operations (this layer)Operations
Panoptes (this product)Archon
Platform servicesPlatform services
ServerAPI ManagementConnect
Further reading
Guides and posts on Panoptes
 Guide · Data qualityData quality checks for AI agents in automated processesThe checks a record must pass before an AI agent may act on it, and the monitoring that catches what slips through. Shapes, business rules, freshness limits, confidence and quarantine, drift, and how a bad record is traced and fixed at the source, with the audit record each step leaves. · updated November 18, 2026 · 13 min read
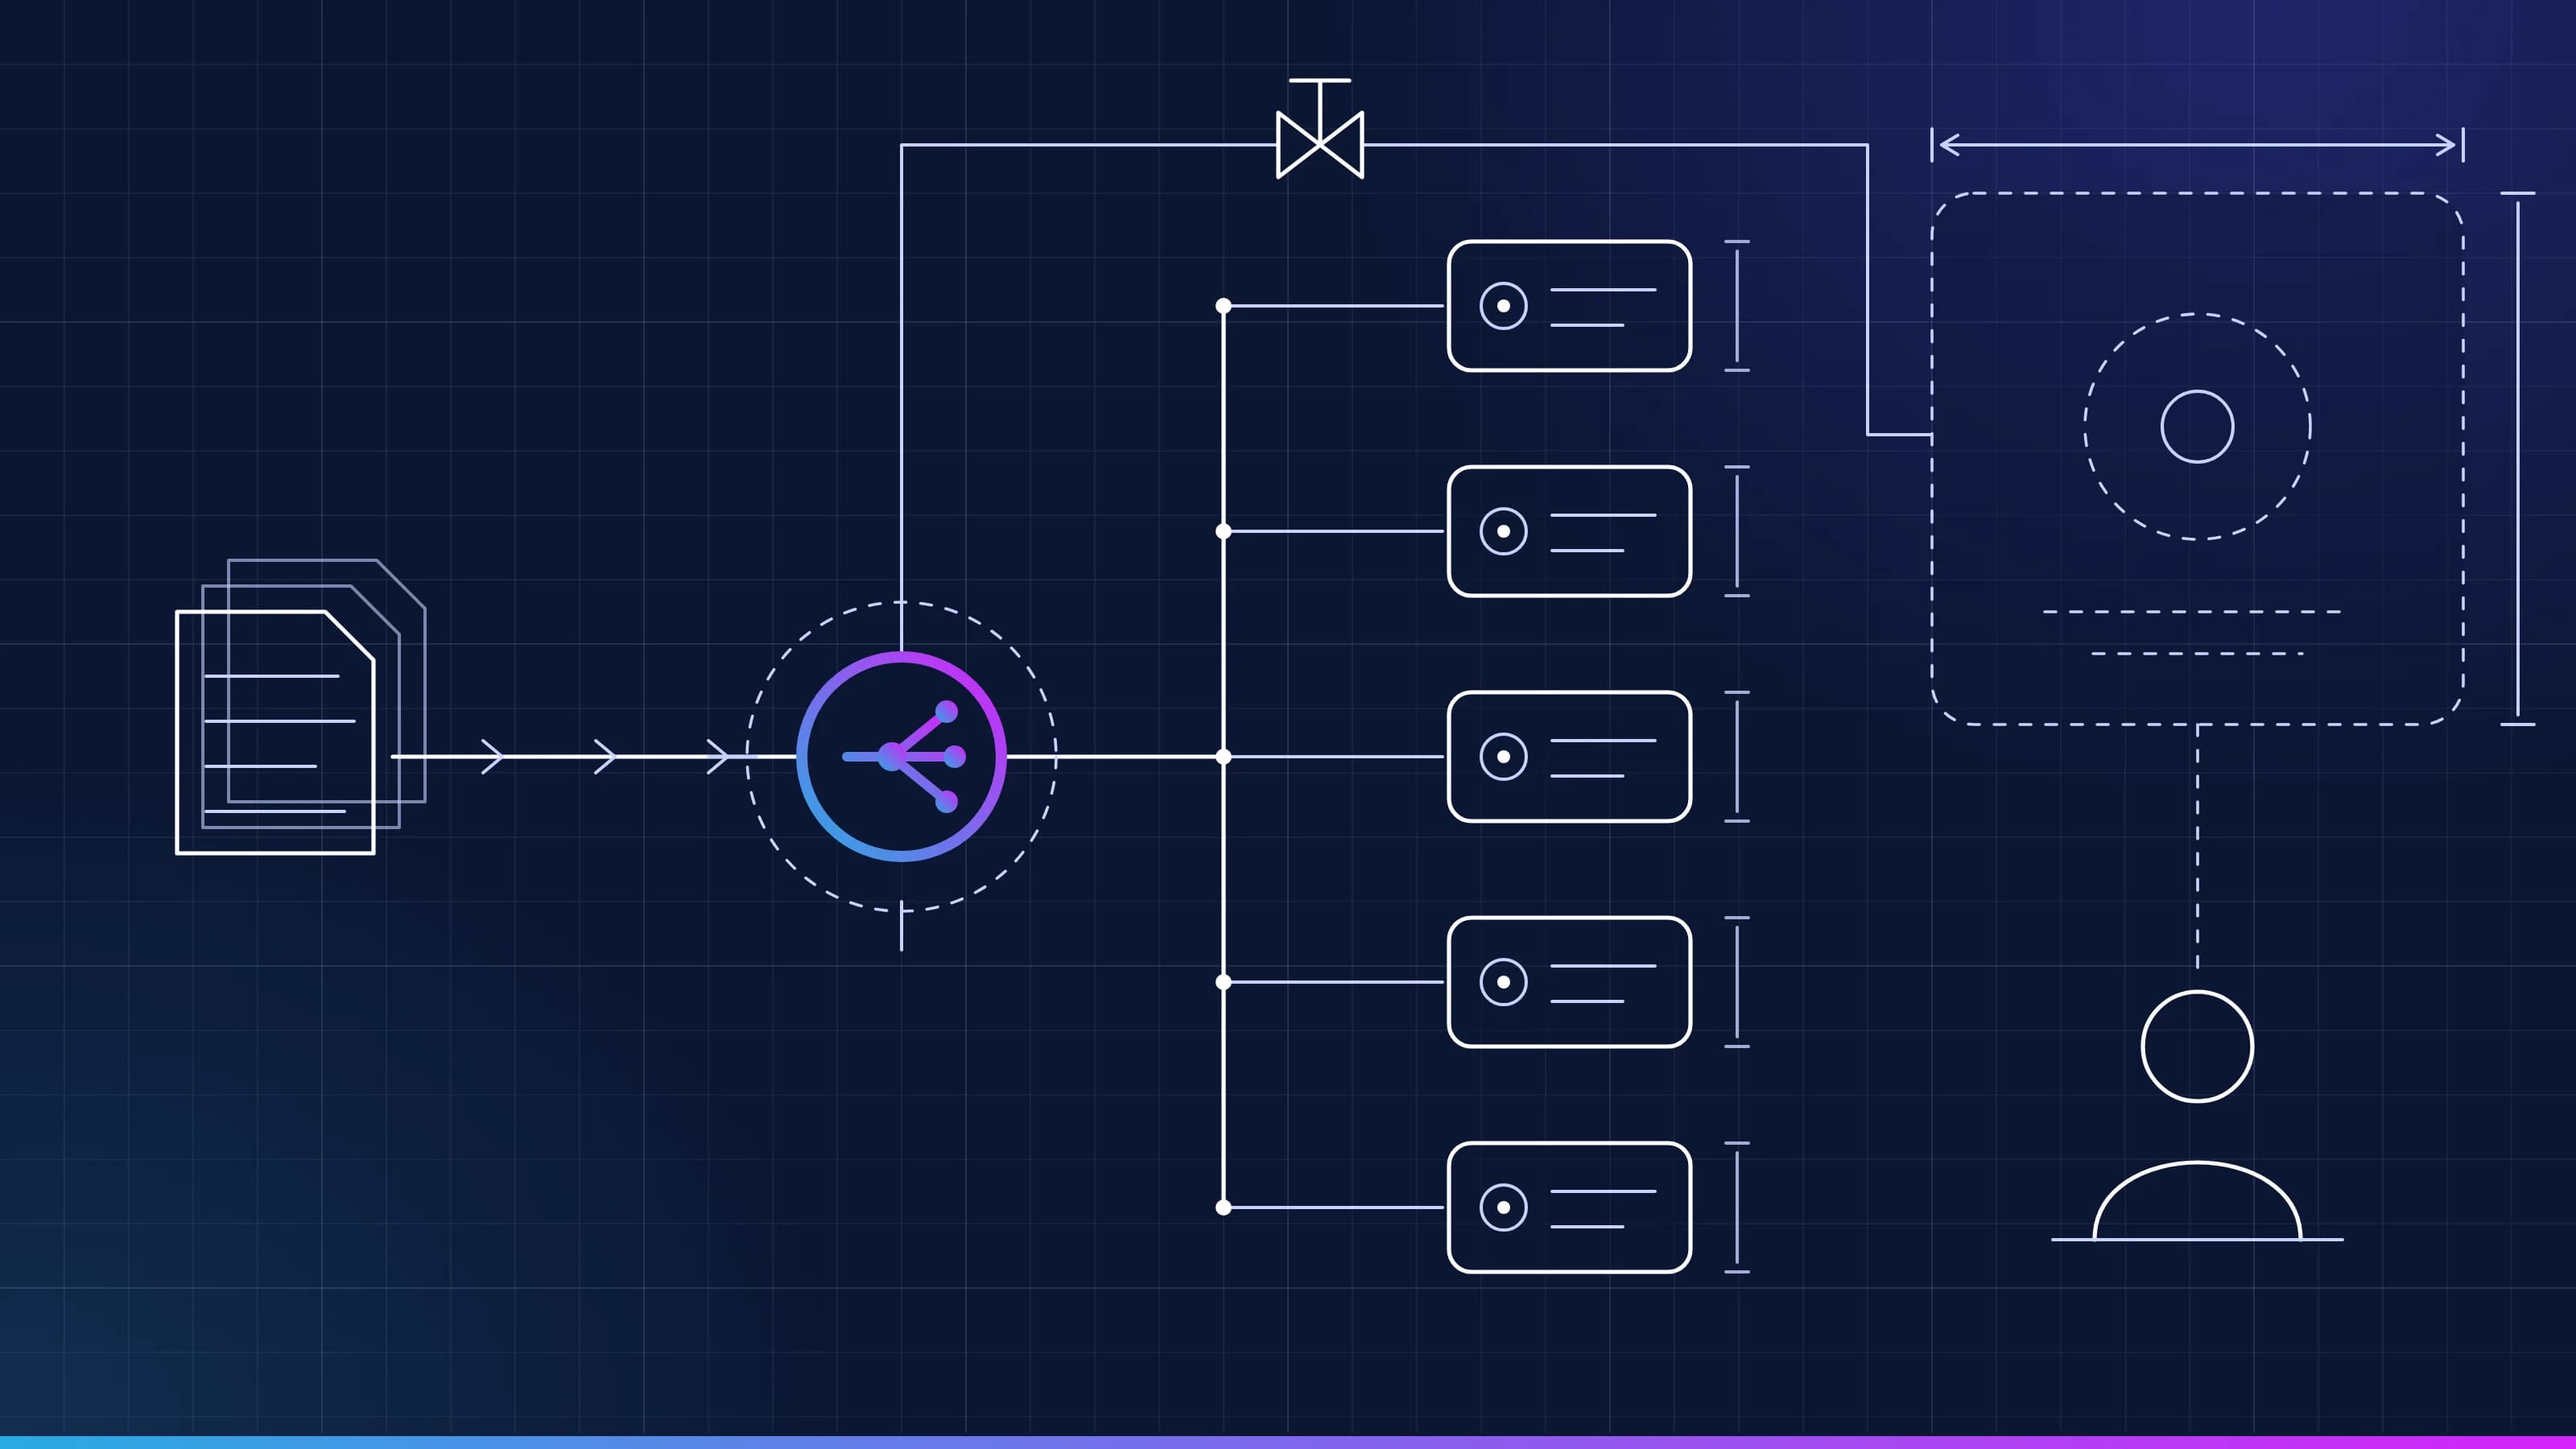 Guide · Small language modelsSLMs for enterprise AI agents: routing, fine-tuning and limitsHow to move an enterprise agent's routine model calls to small language models without losing accuracy: the published conversion method, routing and escalation, LoRA fine-tuning, the gates a model passes before it serves, hardware sizing with worked numbers, and where small models still fail. · updated November 18, 2026 · 18 min read
 Guide · QualityHow to measure AI cost per correct taskA per-task price shows what the AI charged. To know what the work cost, you need the formula, the baseline to take first, and a worksheet your finance team can fill in with its own numbers. · updated November 18, 2026 · 8 min read
 Article · GovernanceIs it safe to give AI a login?Work that crosses systems needs a login, and a login is what a security team guards hardest. These are the five controls that make a Virtual Employee safe to credential, how the kill switch works, and the one number a security team should watch. · updated November 18, 2026 · 8 min read
 Article · ModelsThe model is a replaceable partThe best AI model this quarter won't be the best next quarter. When you can switch AI models without touching your rules, approvals or audit record, every better model shows up on the scoreboard in your cost per correct task. · updated November 20, 2026 · 7 min read
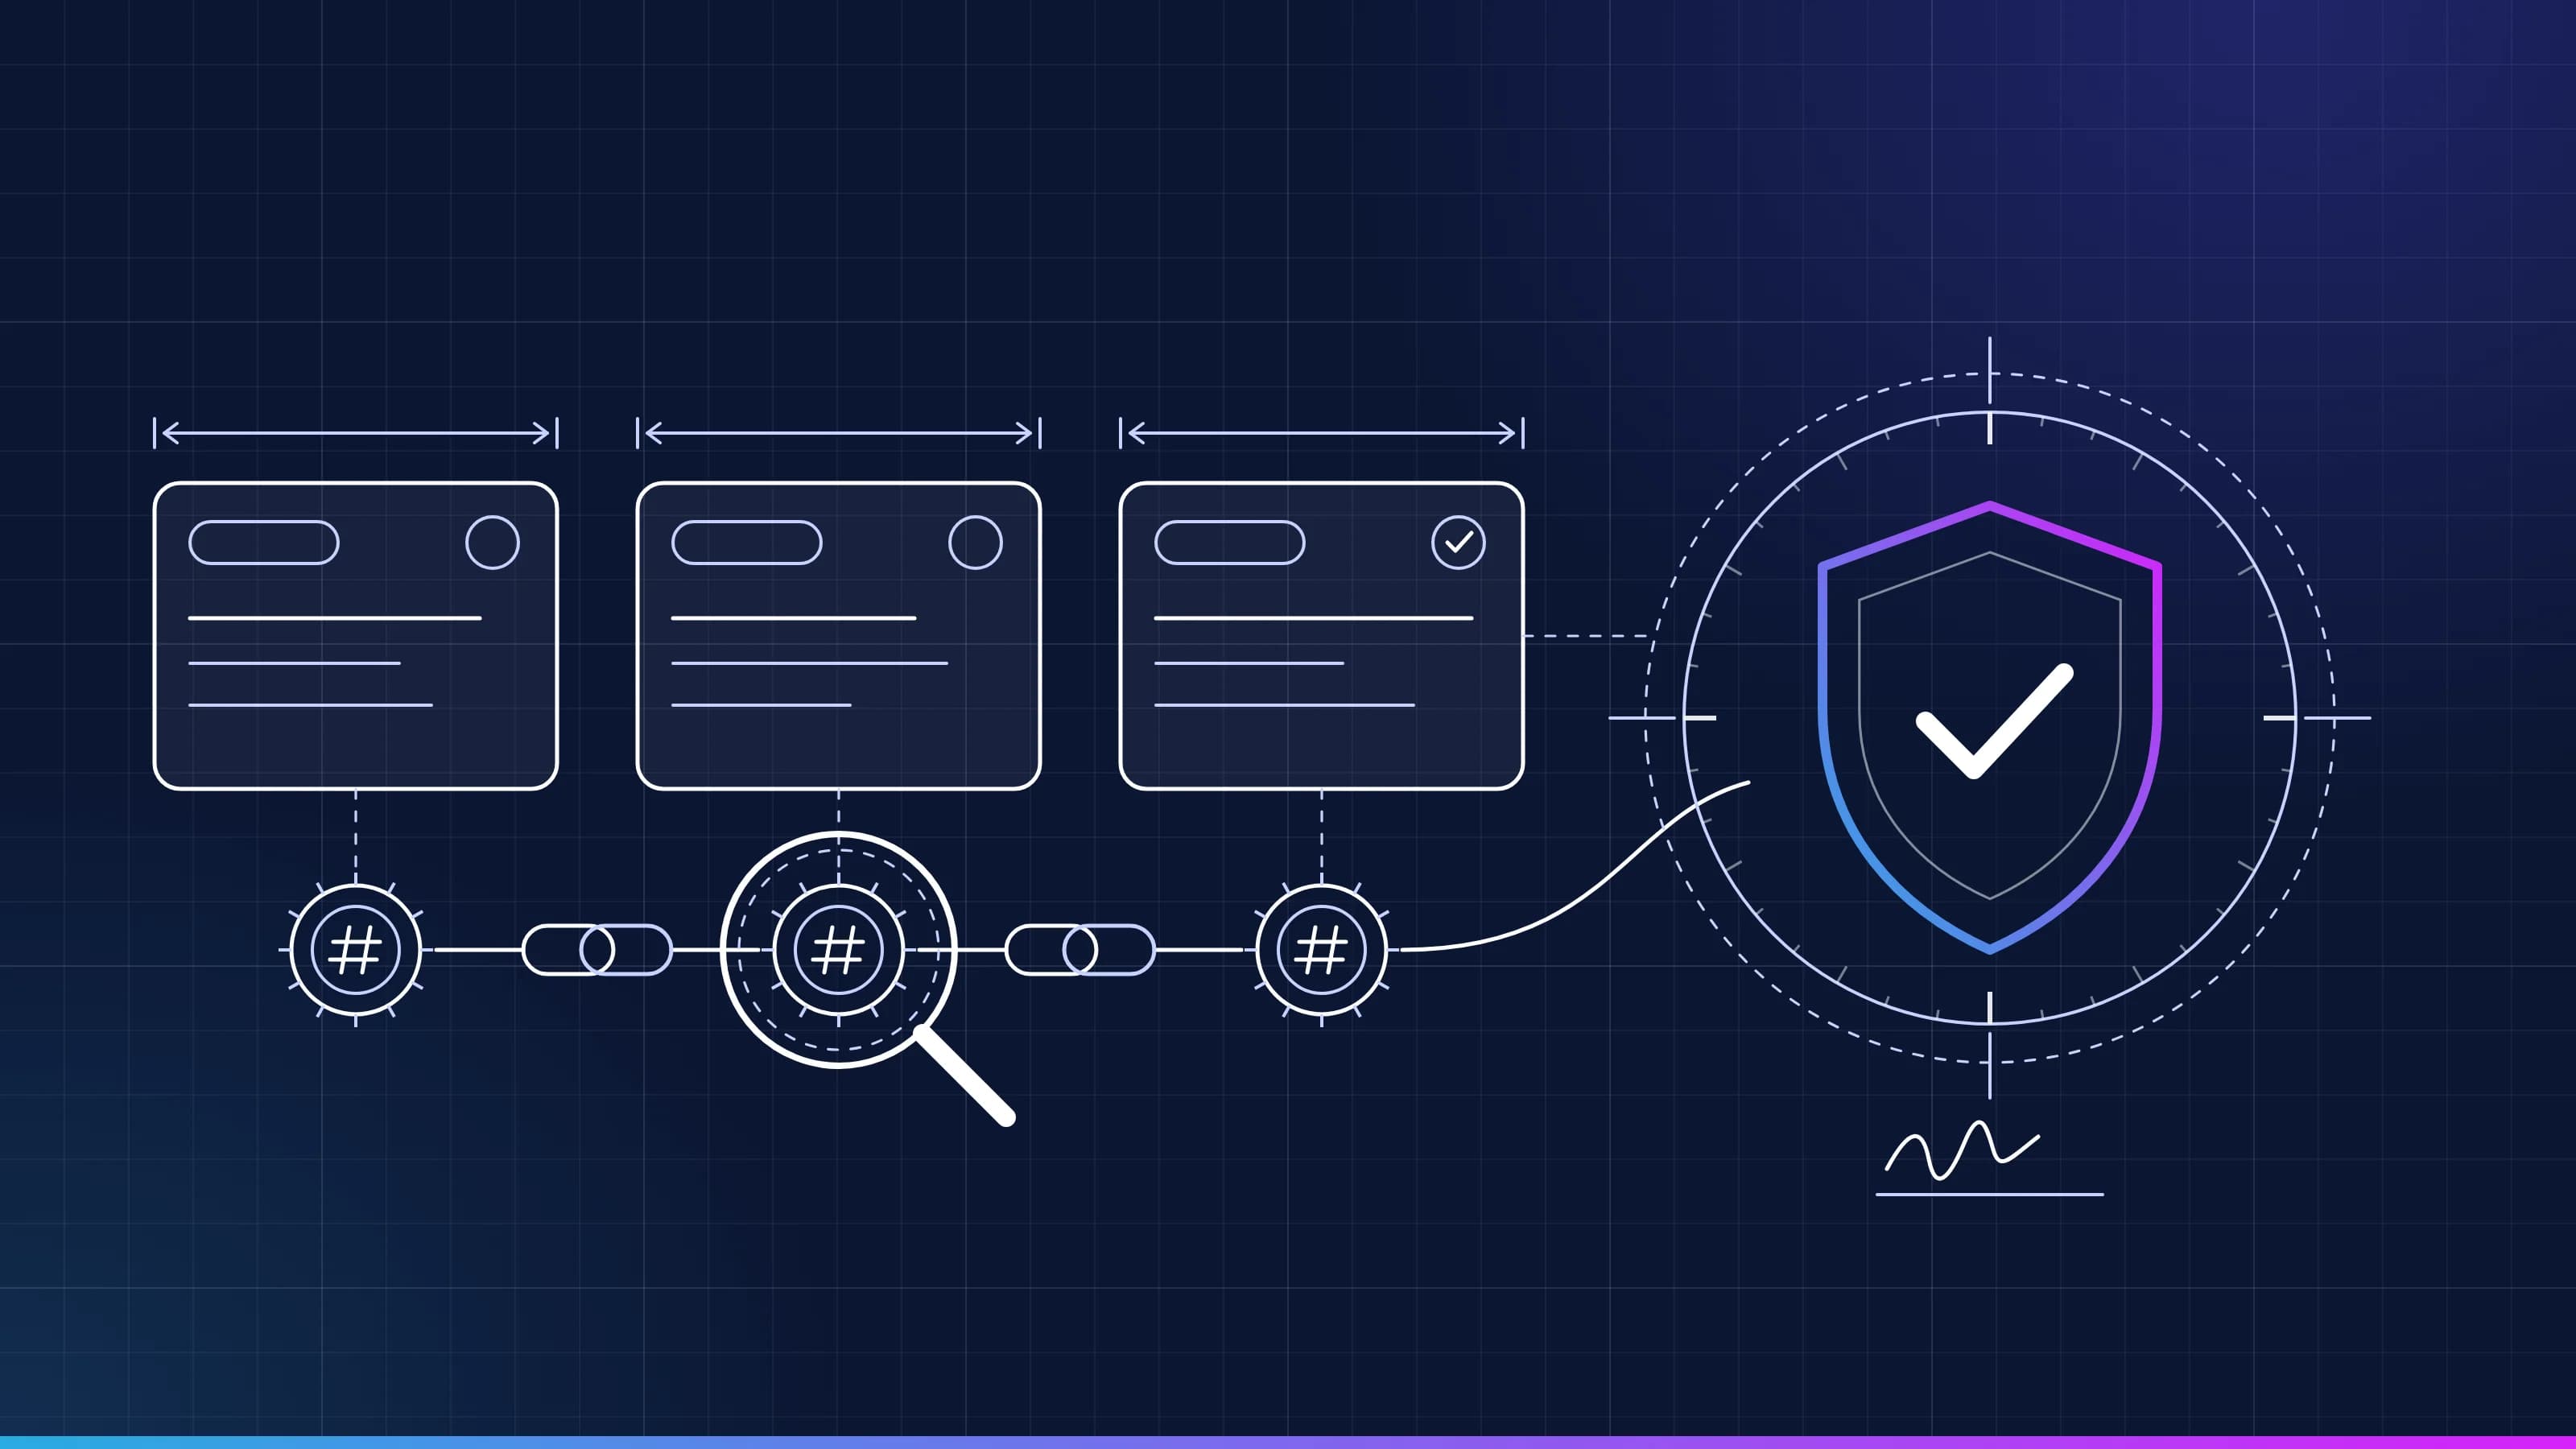 Guide · AI audit trailRead a task recordEvery task Inovagio runs leaves a tamper-evident record. Here is what each line means, how the seals chain together, and how to replay a task end to end. · updated November 18, 2026 · 5 min read
See Panoptes on one of your workflows.
Every project starts with one workflow your people know well, measured against what it costs you today.